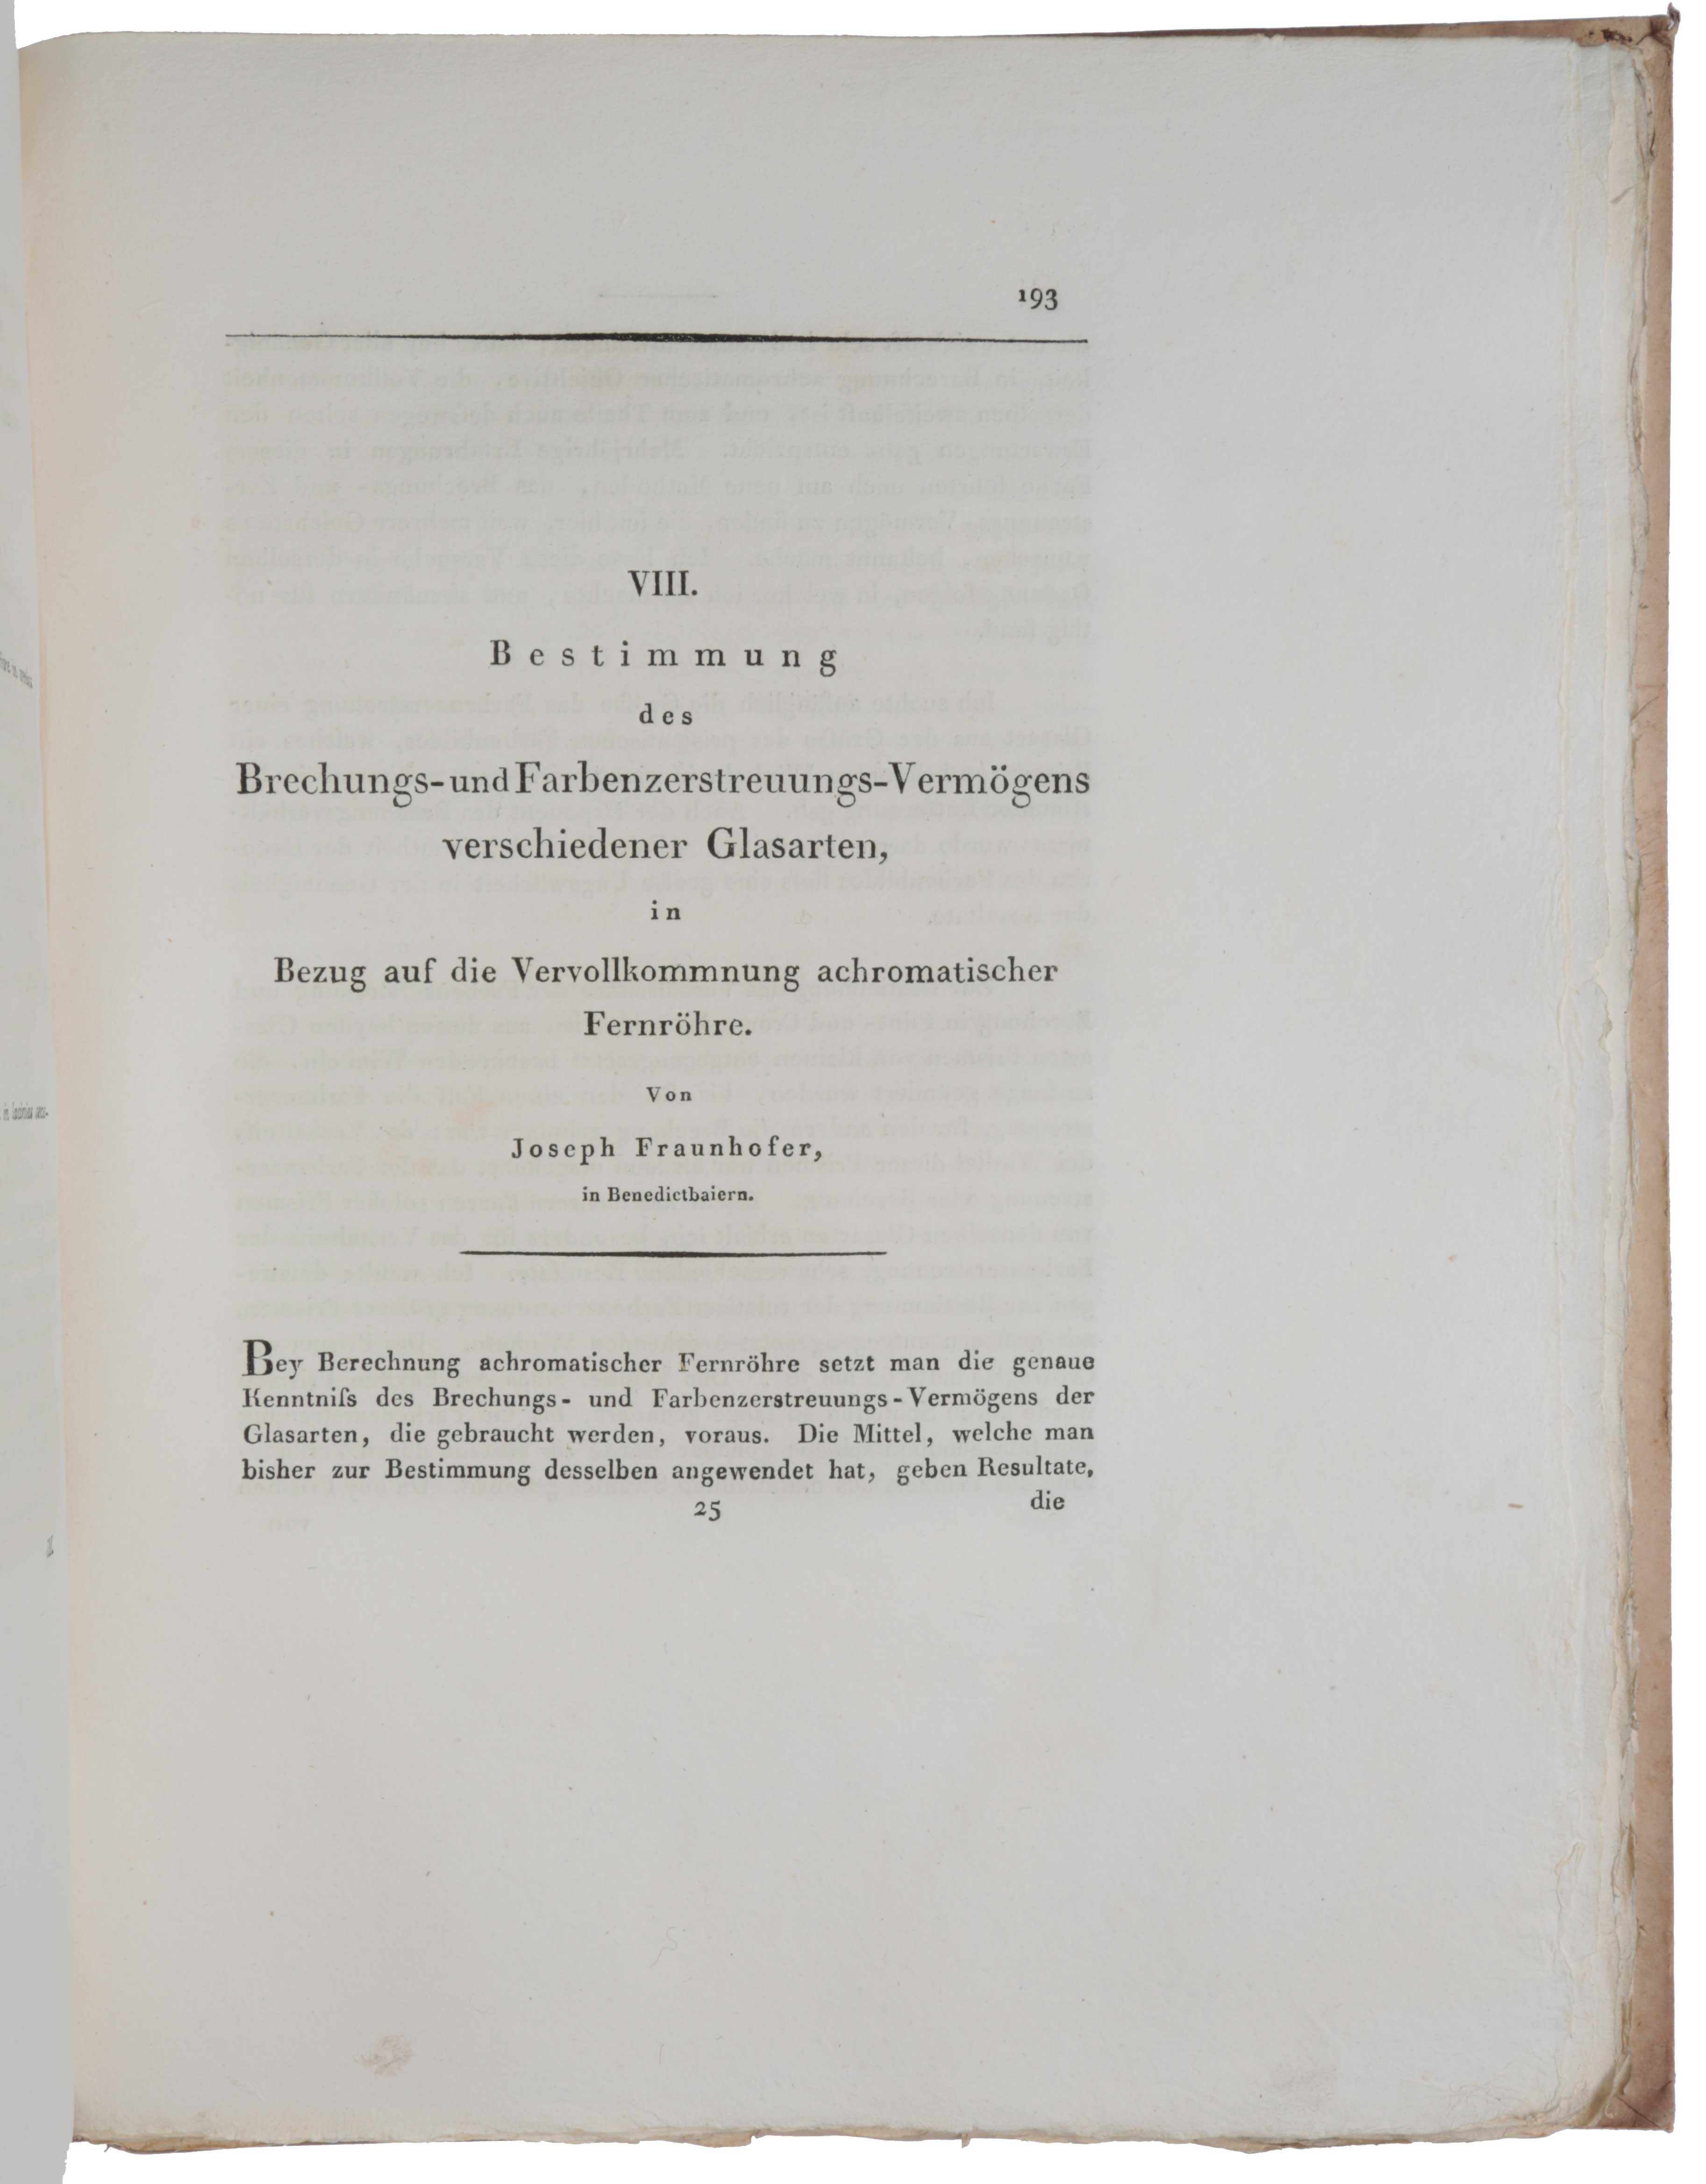
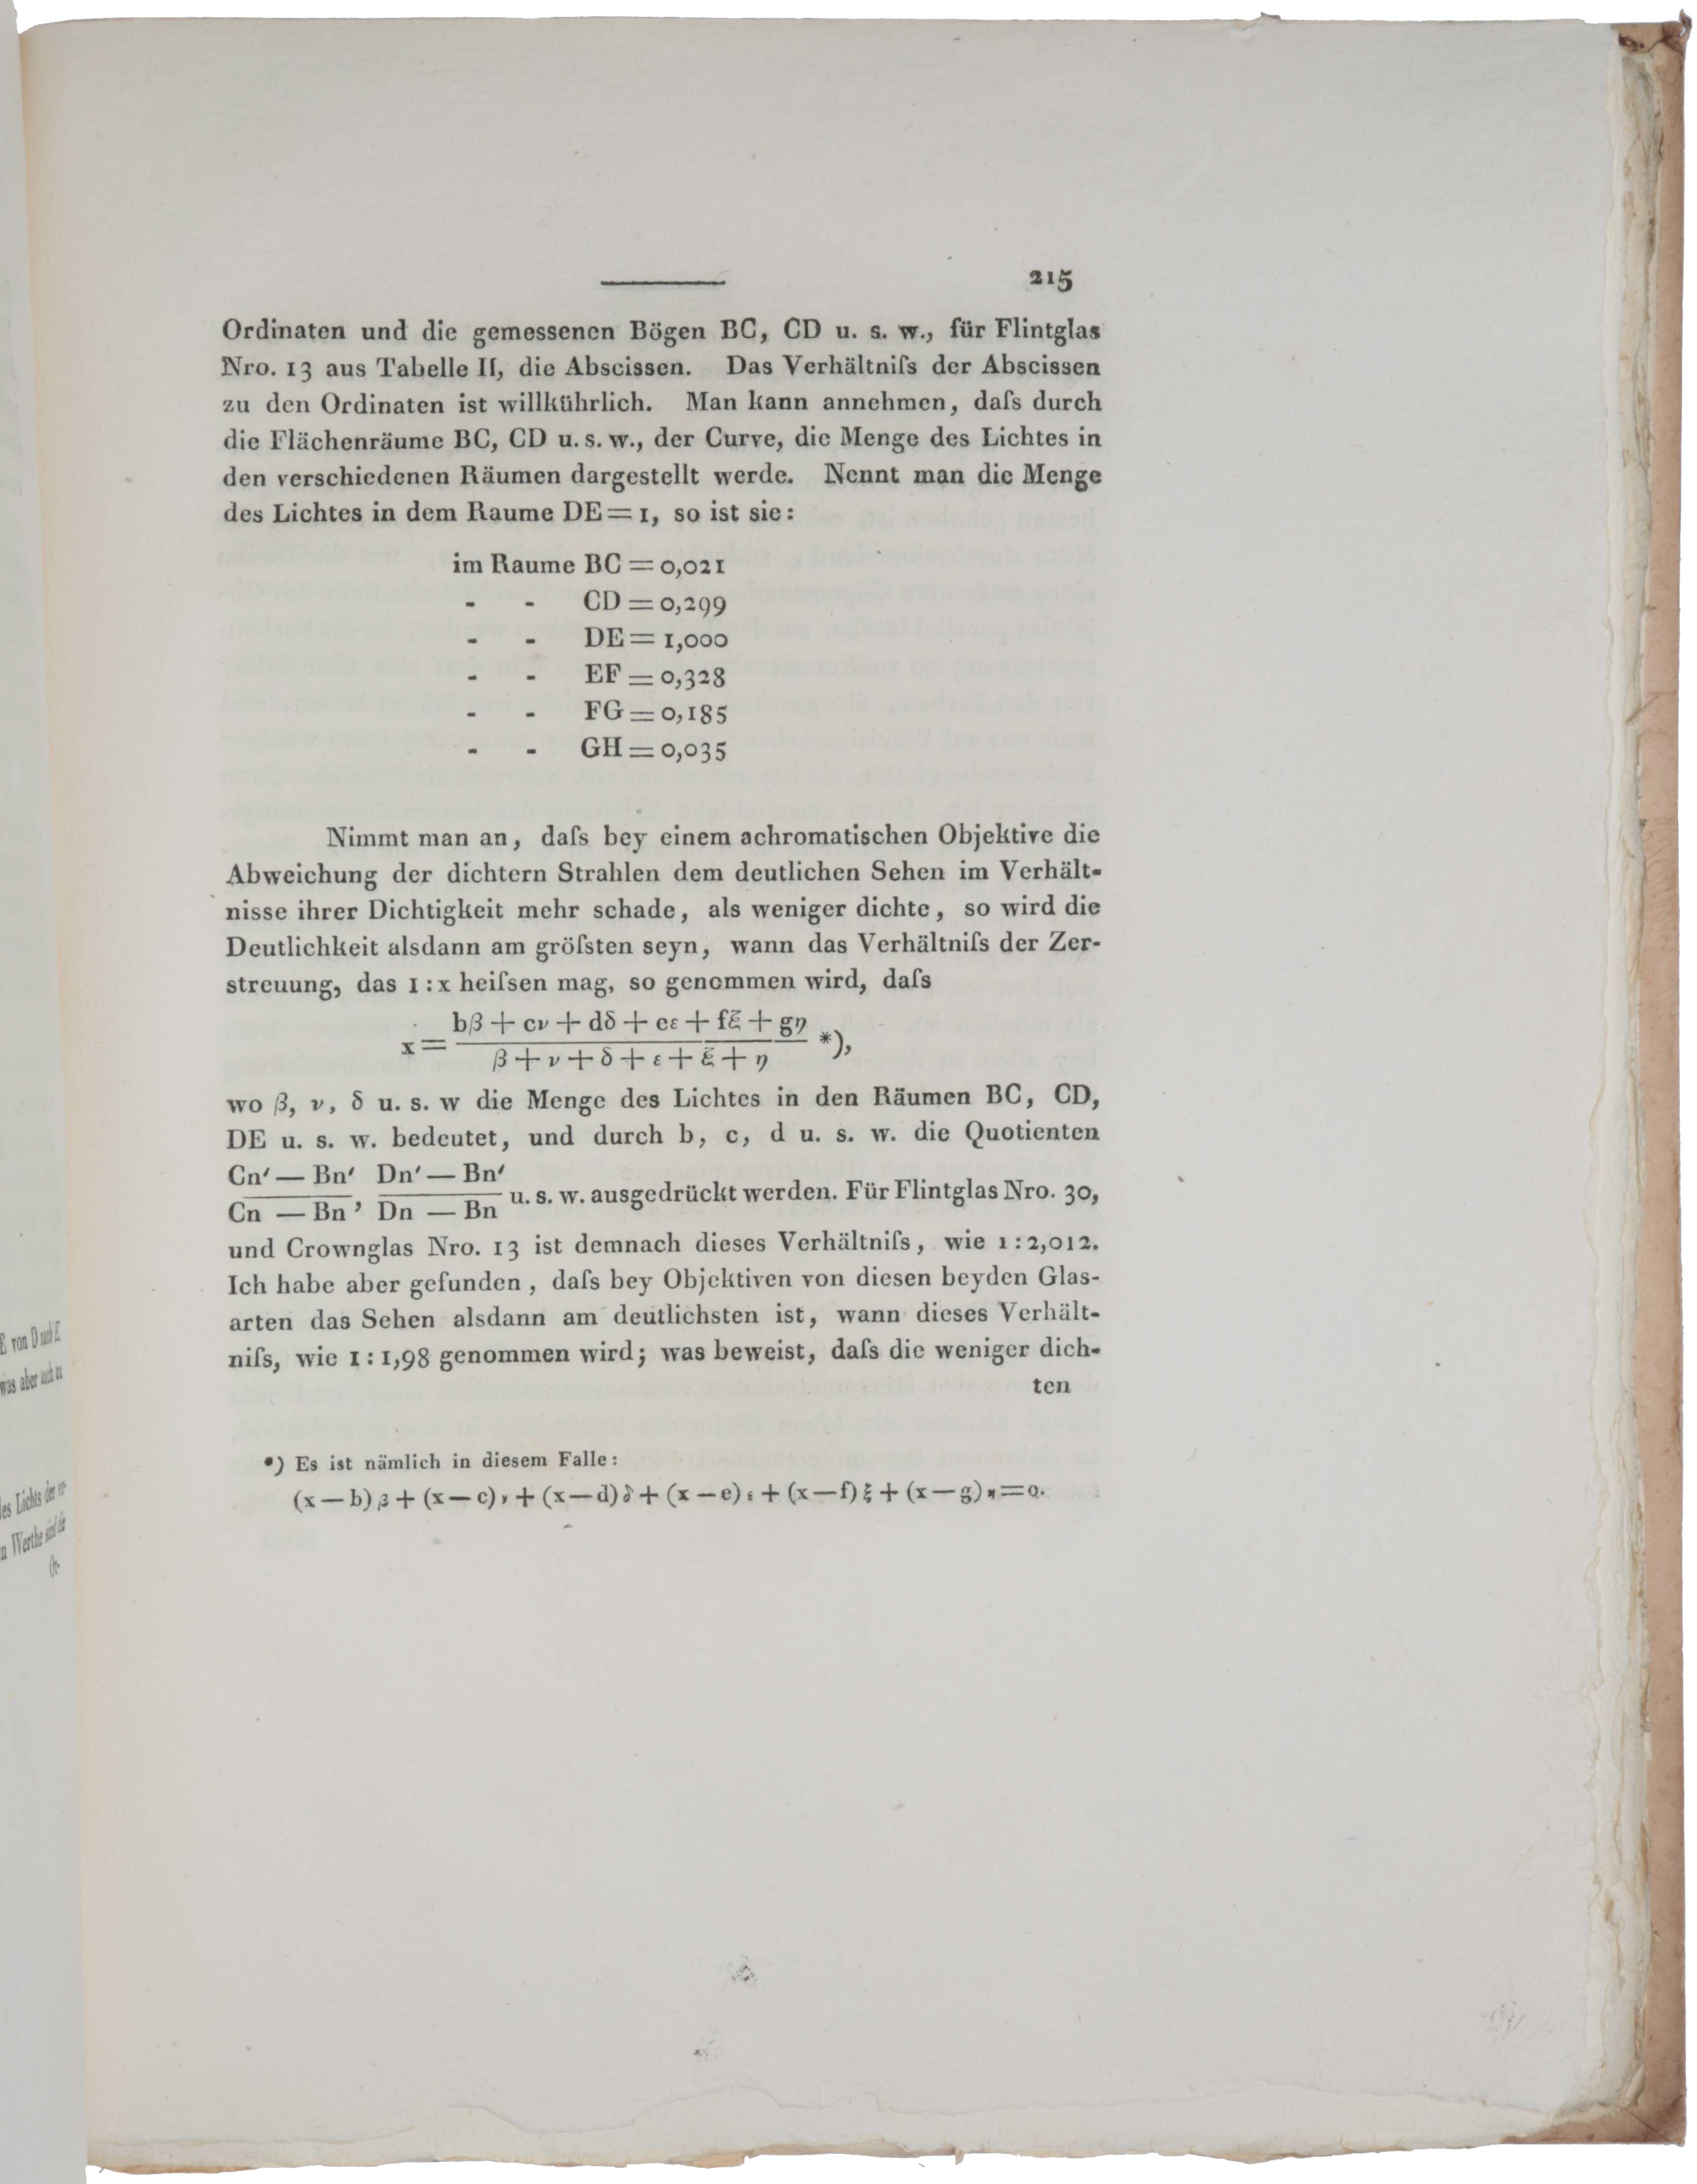
Bestimmung des Brechungs- und Farbenzerstreuungs- Vermögens verschiedener Glasarten, pp. 193-226 and three engraved plates in: Denkschriften der königlichen Akademie der Wissenschaften zu München für die Jahre 1814 und 1815.
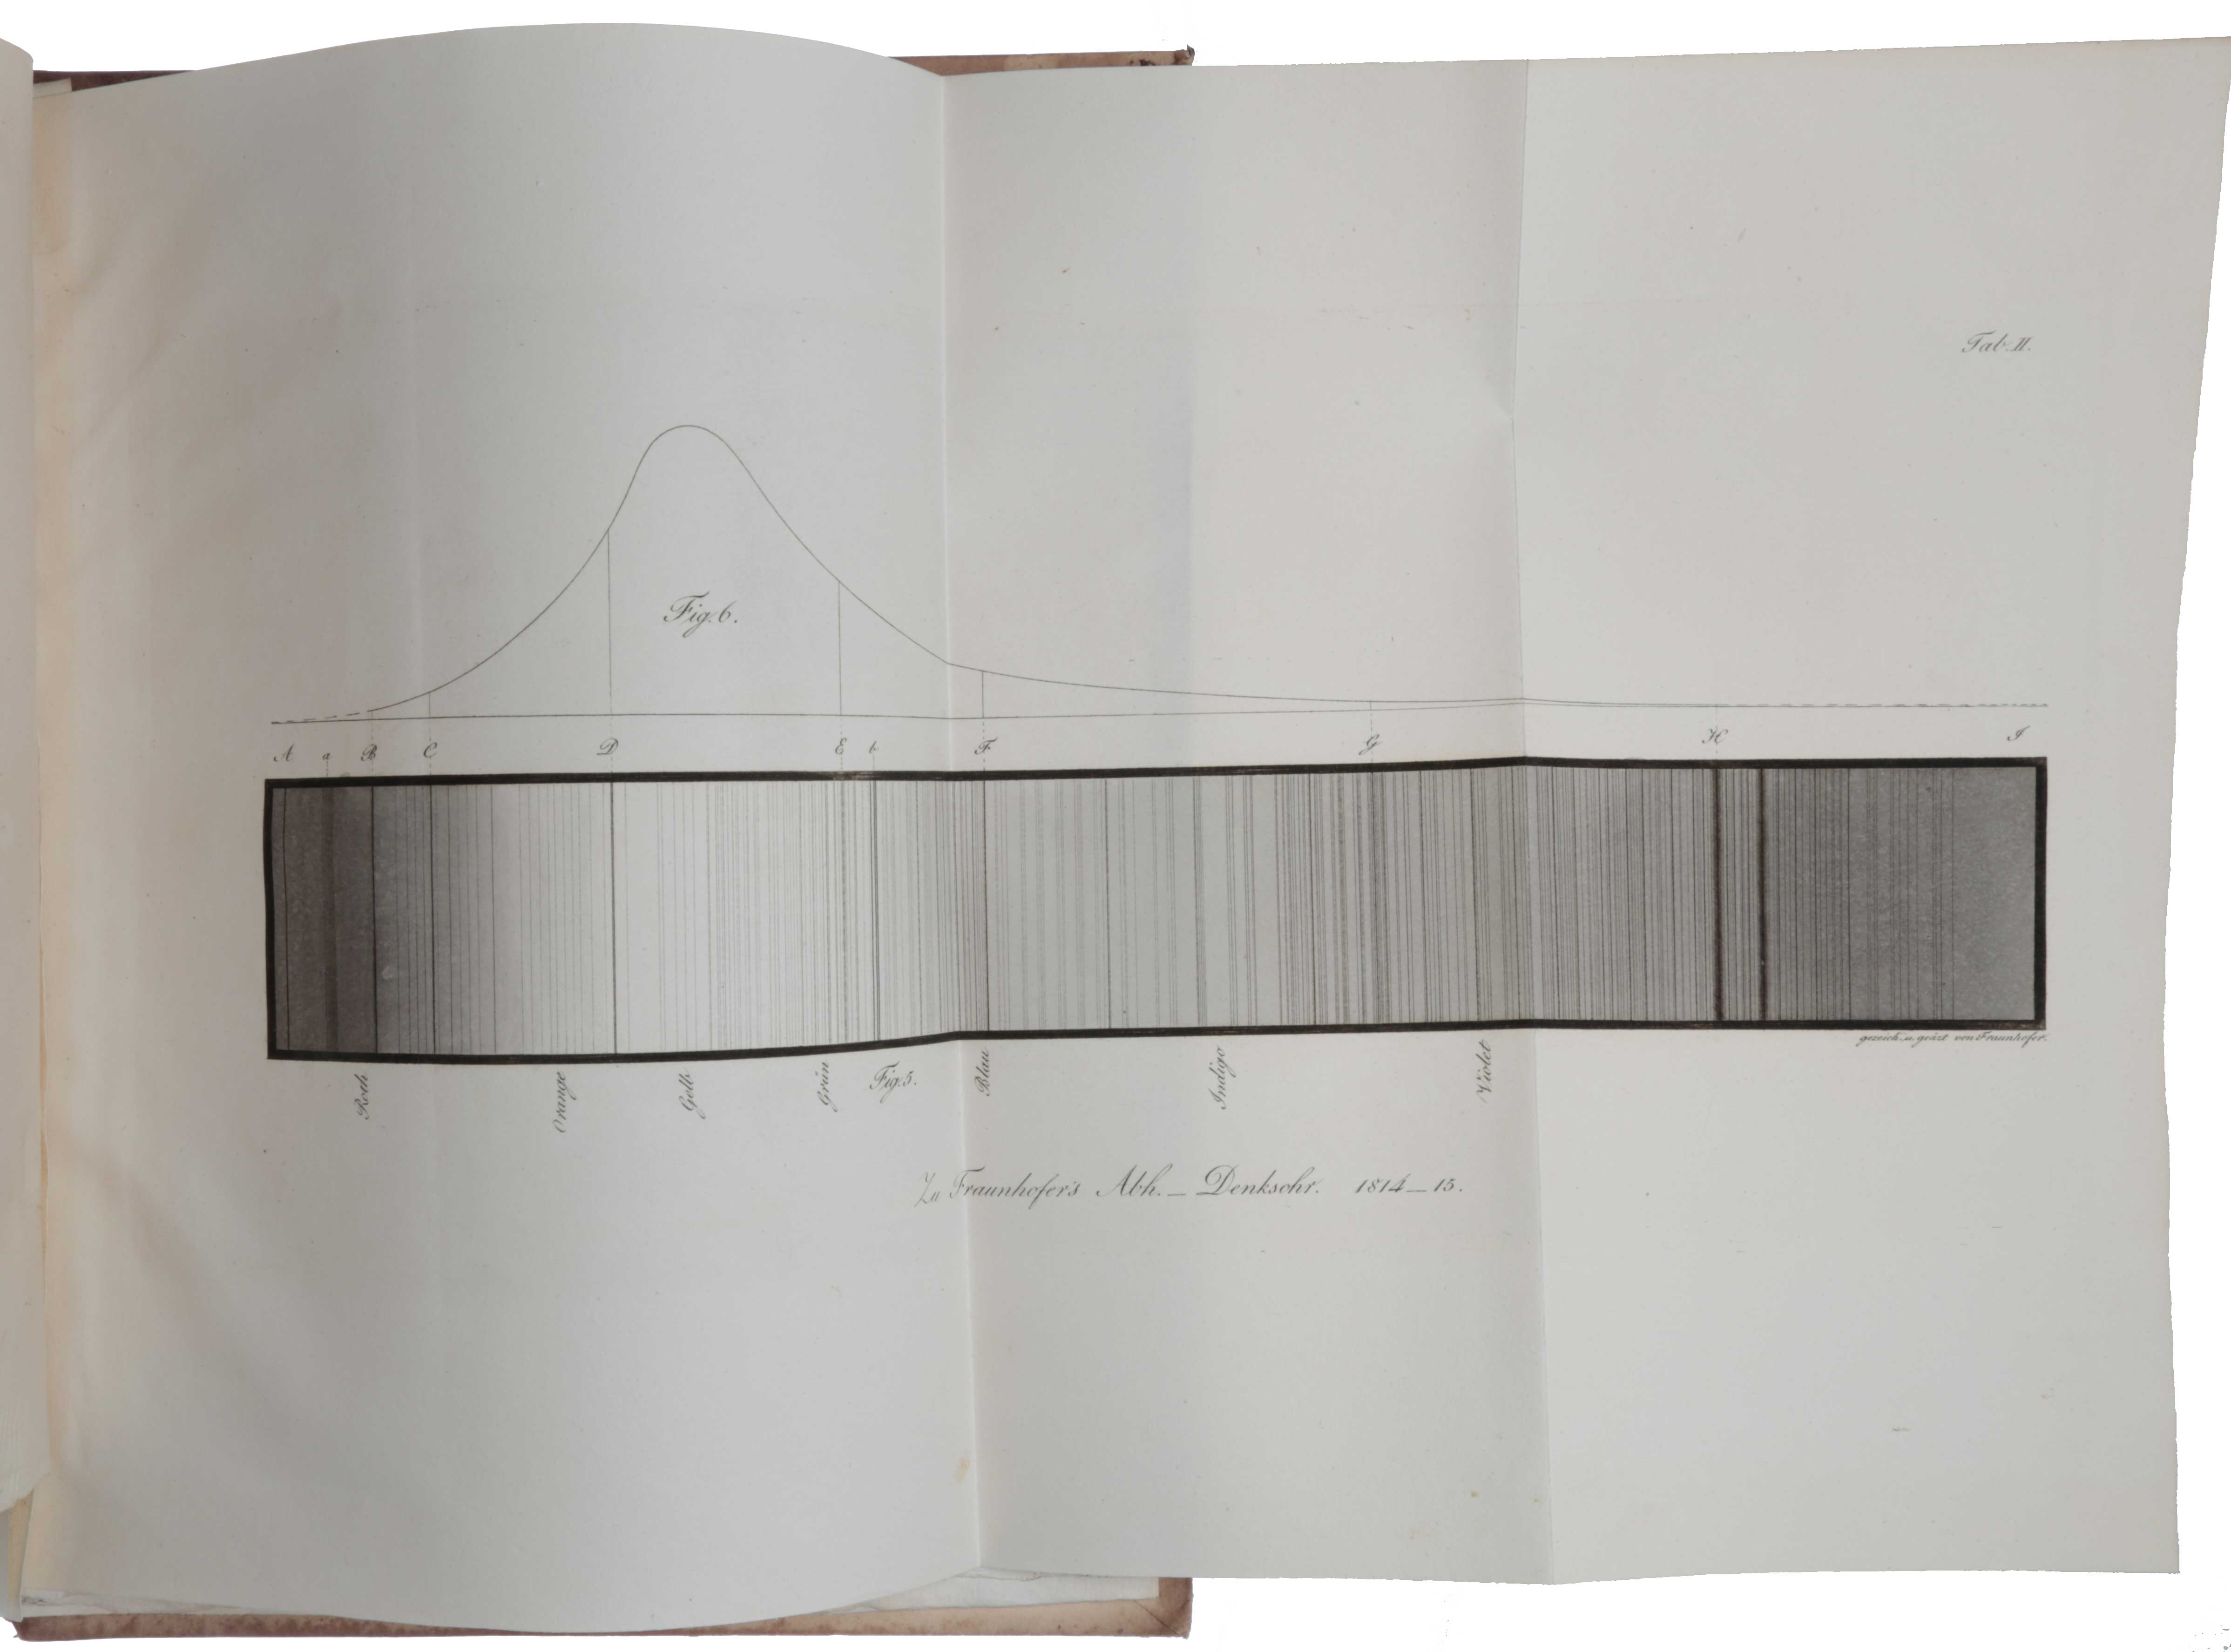
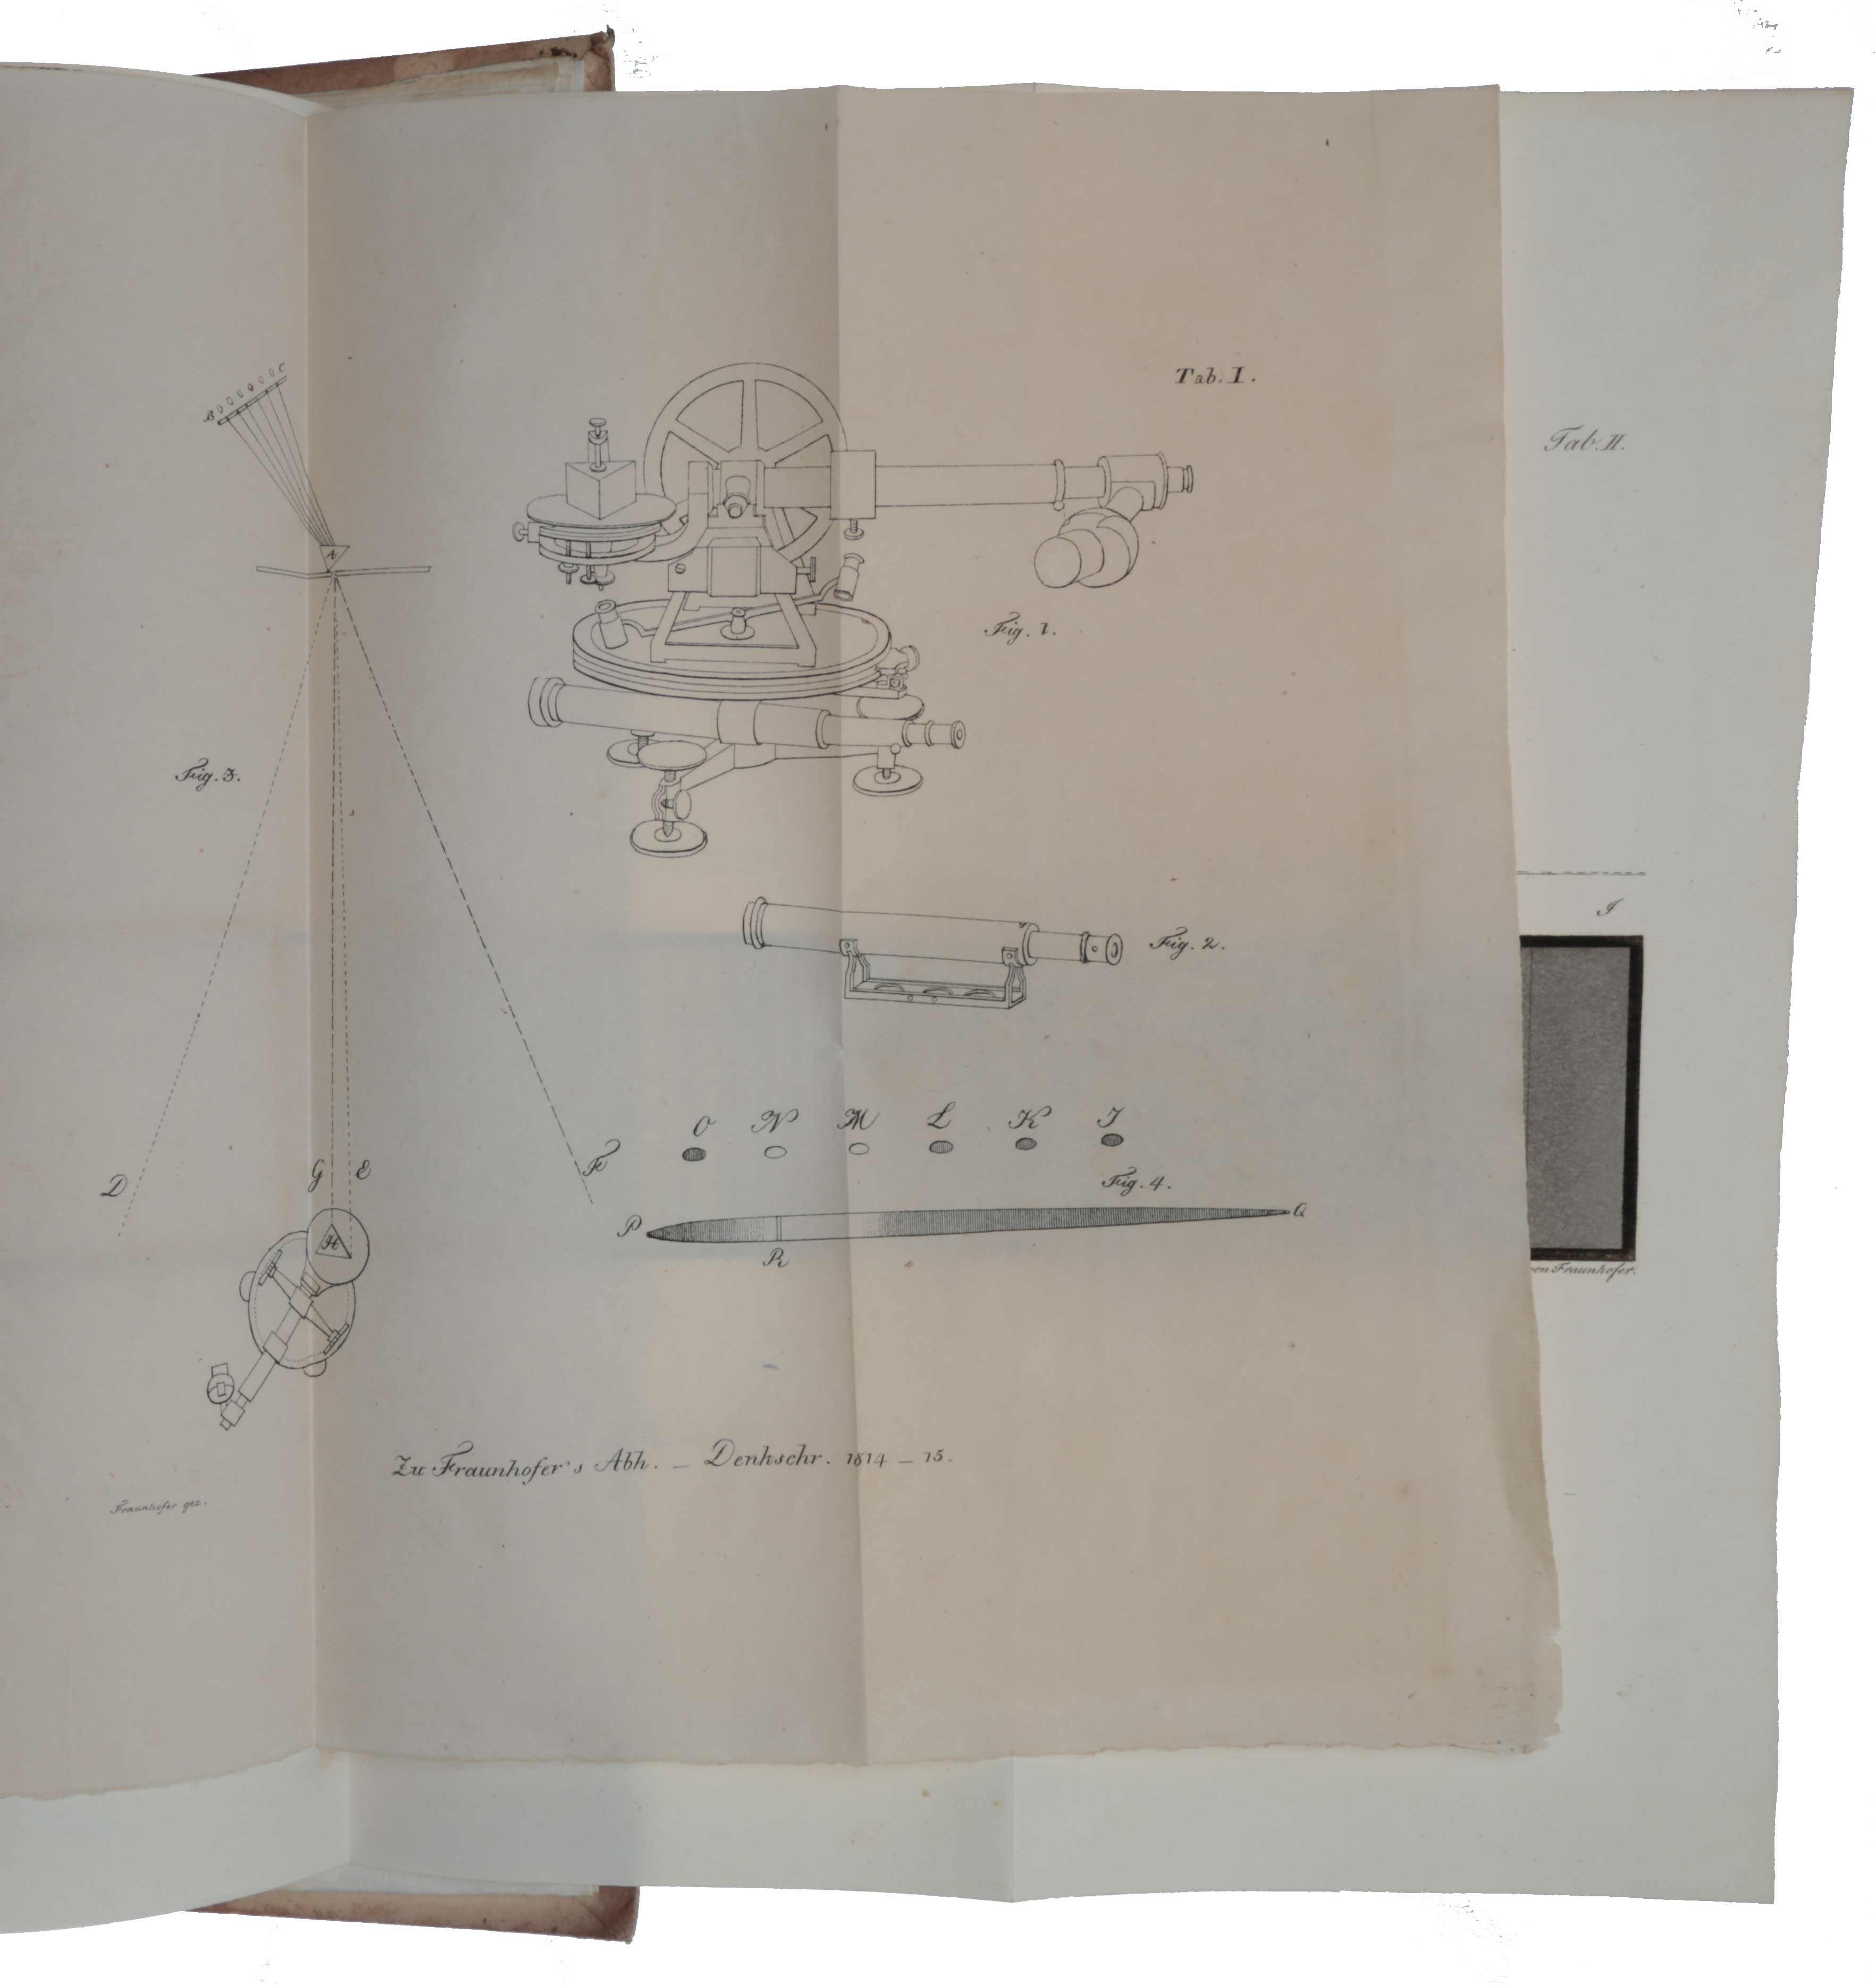
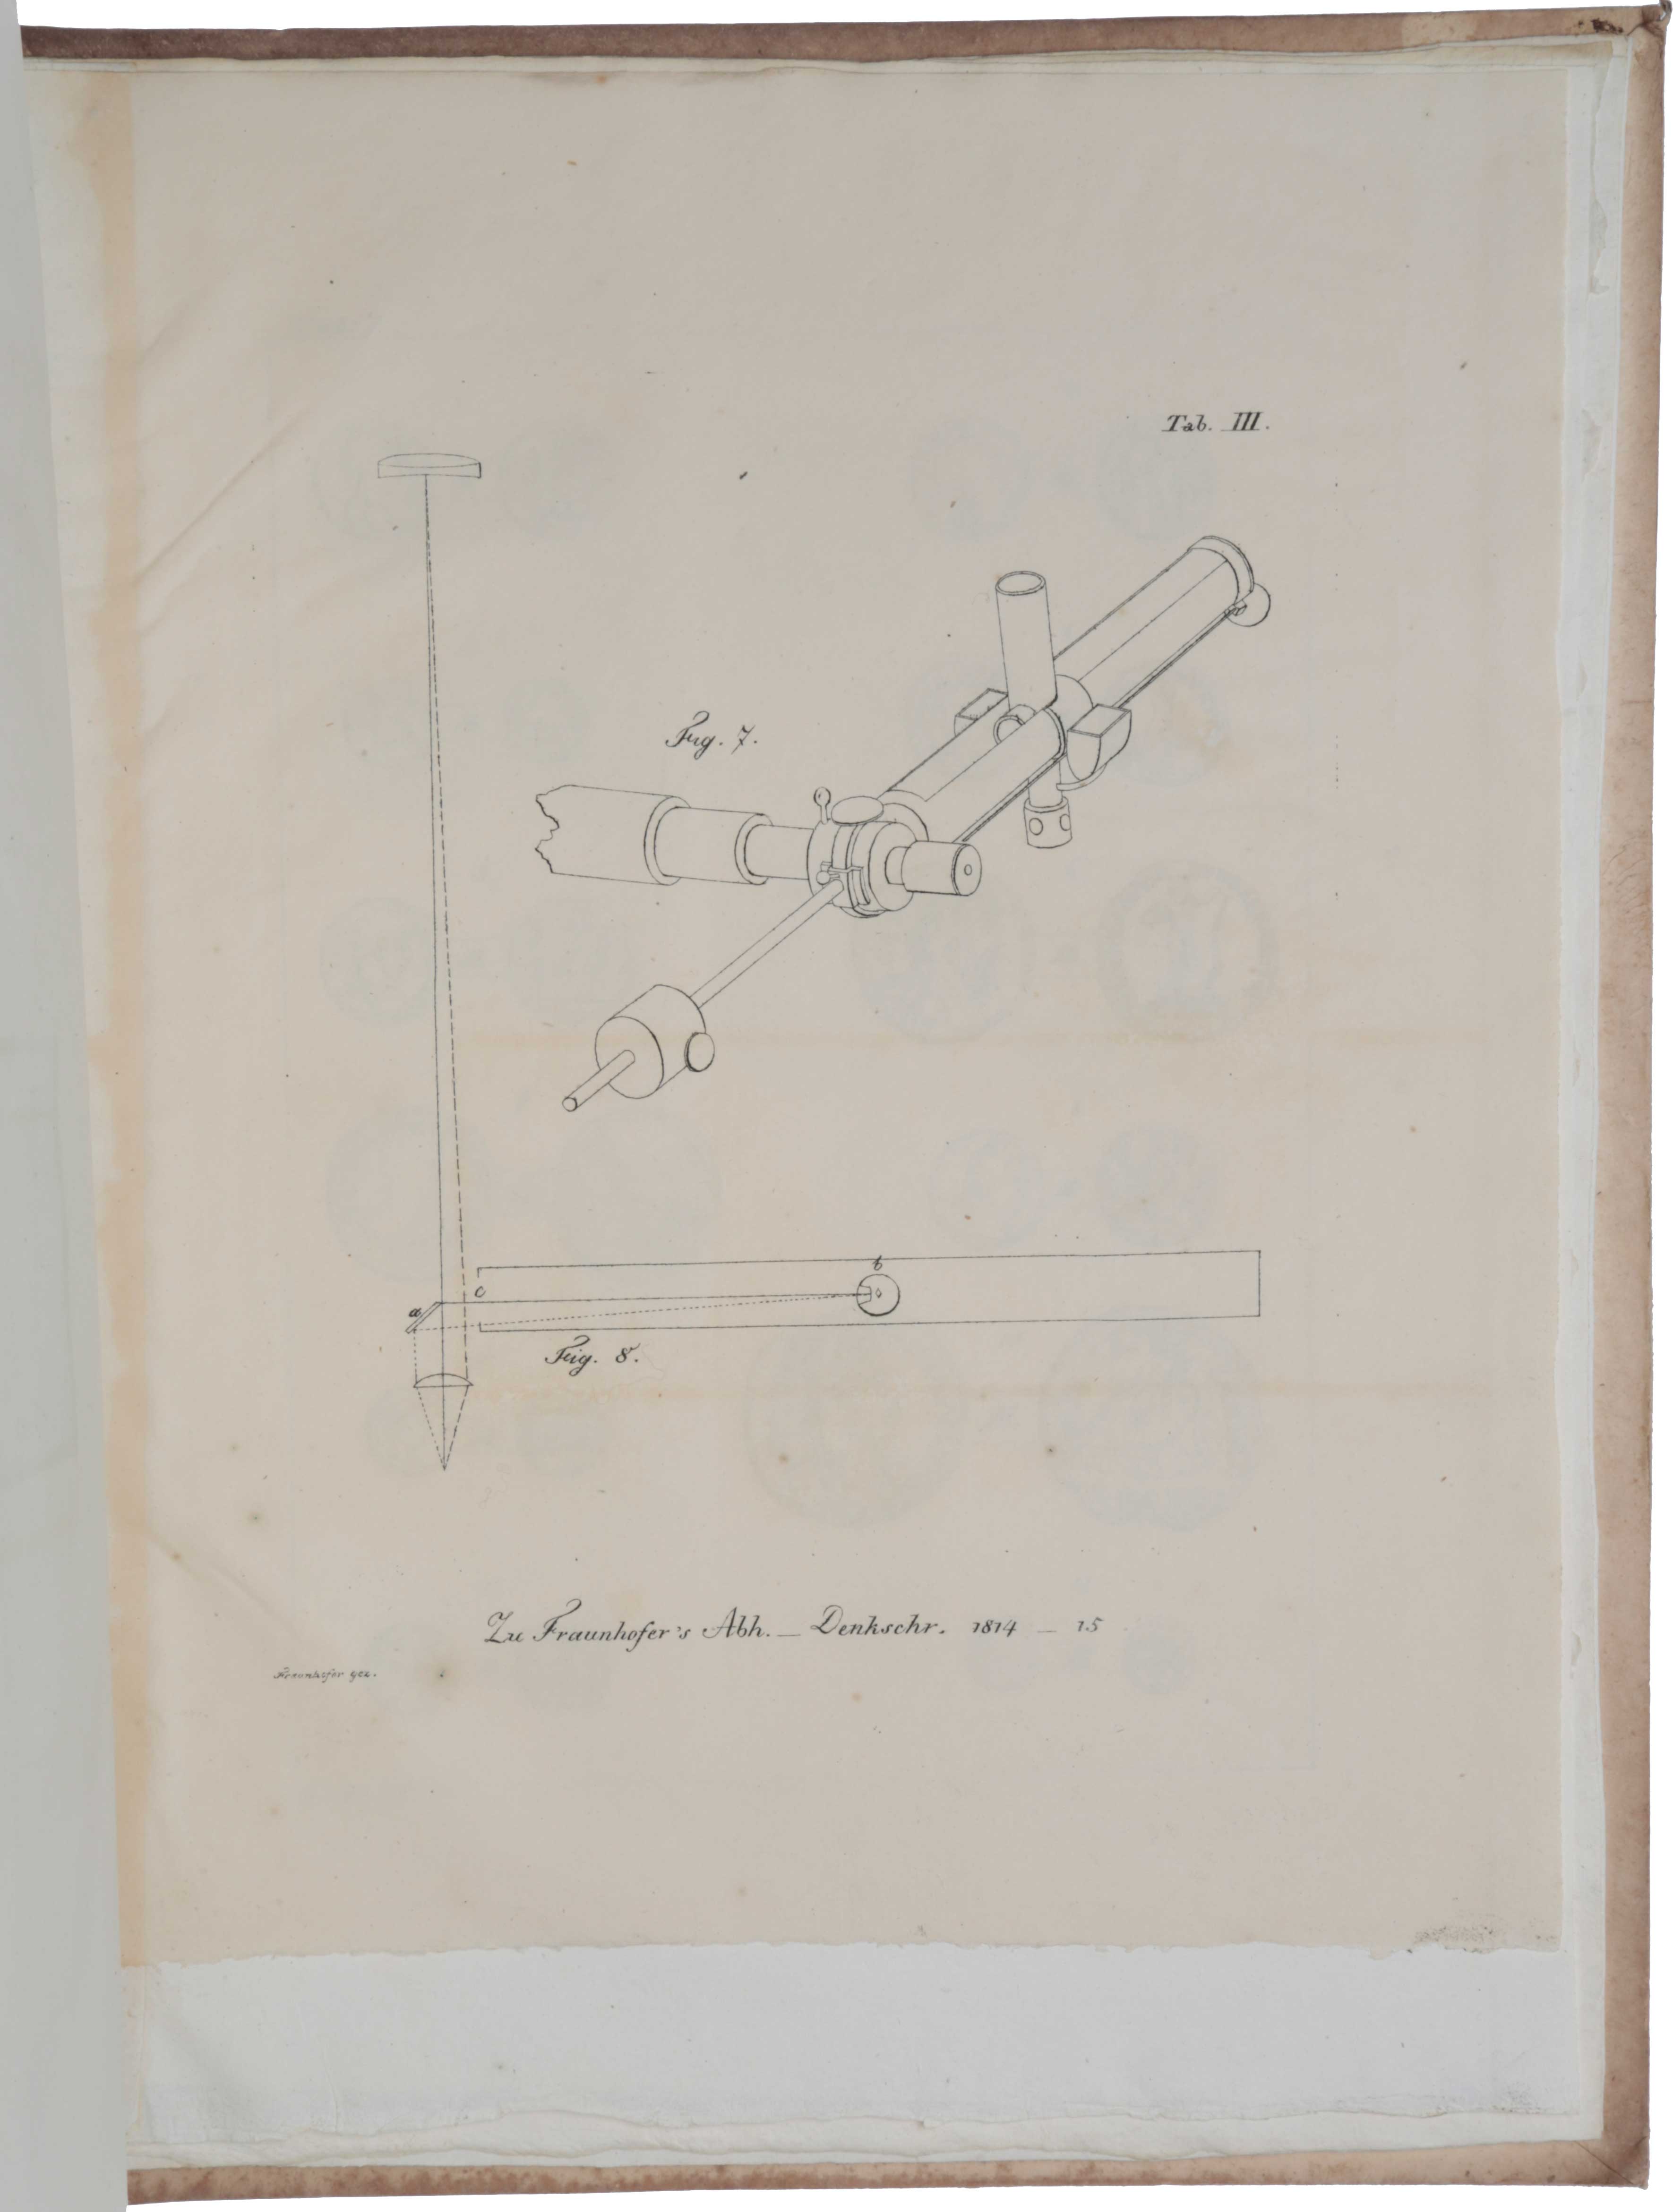
München: Lentner, [1817]. First edition, journal issue, of the founding work of astrophysics, the discovery of the absorption lines in the solar spectrum; the second plate, which reproduces Fraunhofer’s drawing of these lines (etched by Fraunhofer himself), is the first illustration of the solar spectrum. “In 1802, when describing his new process for measuring the refraction of light, W. H. Wollaston reported the occurrence of dark lines in the solar spectrum but regarded them as simply natural dividing lines between the colours. Fraunhofer, originally not a scientist, but a practising optician, concentrated on these dark lines, and the title of his paper describes the method and purpose of his investigations: ‘Definition of the Capacity of Refraction and Colour-diffusion of various kinds of Glass’ … His achievements justify describing him as the founder of astrophysics. He charted several hundred lines, which have been known as ‘Fraunhofer lines’ ever since” (PMM). "These observations stimulated considerable interest for the next half-century among natural philosophers, whose speculations culminated in the classical explanation of absorption and emission spectra made by Kirchoff and Bunsen in 1859" (DSB). “Fraunhofer’s discovery represented the beginning of what later came to be called chemical spectral analysis, the development of which was associated with the names of David Brewster, John Herschel, William Henry Fox Talbot, Charles Wheatstone, Antoine-Philibert Masson, Anders Jonas Ångström and William Swan. These investigators examined the origin of the dark lines in the solar spectrum – the so-called Fraunhofer lines – and suggested that they might be created by the selective absorption of light emitted by the sun in its atmosphere. The question then arose as to which chemical substances emitted which particular discrete lines. The final and conclusive steps towards chemical spectral analysis, however, were taken by the chemist Robert Bunsen and the physicist Gustav Kirchhoff” (Mehra & Rechenberg I, p. 157). They concluded that the cool, outer regions of the solar atmosphere contained iron, calcium, magnesium, sodium, nickel and chromium and probably cobalt, barium, copper and zinc as well. ABPC/RBH list only one other copy of this journal issue since 1965 (It is rarer in commerce than the offprint). “Fraunhofer (1787-1826) came from humble parentage in Straubing near Munich and had very little formal education, having lost both parents when he was eleven. In 1807, at the age of 20, he was hired by the Mathematical Mechanical Institute Reichenbach, Utzschneider and Liebherr, a firm founded in 1804 for the production of military and surveying instruments, for which high-quality optical glass for lenses was essential. The optical works of the firm were outside Munich, at a disused monastery in Benediktbeuern, where Fraunhofer received his training from a Swiss named Pierre Guinand (1748-1824). Guinand’s considerable reputation rested on his skill in the production of relatively large and optically pure pieces of crown and flint glass. However, owing to a clash of personalities, Guinand resigned his contract in 1814 and returned to Switzerland, and at this time the whole firm passed into the hands of Joseph von Utzschneider and Fraunhofer. “The success of this famous early glass factory lay in the production of optical crown and flint glass free from bubbles and veins. The technique of stirring the molten glass was discovered by Guinand and developed by Fraunhofer. The use of these glasses enabled Fraunhofer to construct achromatic optical instruments of hitherto unsurpassed quality, and this was undoubtedly a key factor in his successful pioneering work in solar spectroscopy. Fraunhofer embarked on a careful examination of the optical properties of his glass, so as to measure the refractive index and dispersion. His work on the solar spectrum can therefore be seen as the means to Fraunhofer’s end goal of perfecting optical instruments, for he realized that accurate refractive indices must be measured in monochromatic light. For, having rediscovered the solar absorption lines, he saw that the lines defined the precise wavelength of the light far better than the mere sensation of colour to the human eye. “Fraunhofer observed the solar spectrum using a telescope of 25 mm aperture taken from one of his theodolites. A prism was mounted in front of the objective, and this enabled him to focus a relatively pure spectrum for direct visual inspection through the eyepiece. His introductory words are almost reminiscent of those used by Newton: ‘In a shuttered room I allowed sunlight to pass through a narrow opening in the shutters, which was about 15 seconds broad and 36 minutes high, and thence onto a prism of flint glass, which stood on the theodolite … The theodolite was 24 feet from the window, and the angle of the prism measured about 60 degrees … I wanted to find out whether in the colour-image [i.e., spectrum] of sunlight, a similar bright stripe was to be seen, as in the colour-image of lamplight. But instead of this I found with the telescope almost countless strong and weak vertical lines, which however are darker than the remaining part of the colour-image; some seem to be nearly completely black’ [p. 202]. “Fraunhofer convinced himself that the lines in no way represent colour boundaries, as the same colour is found on both sides of a line with only a gradual and continuous colour change throughout the spectrum. Ten of the strongest lines were labeled with the letters A, a, B, C, D, E, b, F, G and H from the far red to the limit of the eye’s vision in the violet. The last letter was used for the pair of strong violet lines that we now know are due to absorption by calcium. He noted that A was very near the red limit of the spectrum, but he was still able to see some red light beyond this feature. He showed the D feature to be composed of two close dark lines which exactly coincide with the bright lines emitted by lamplight, while b consists of three very strong lines, amongst the strongest in the solar spectrum. The G feature was also found to be composite, consisting of ‘many lines clustered together, among which several stand out through their strength. The two stripes at H are the most extraordinary; they are both almost completely the same and consist of many lines; in their middle is a strong line which is very black’ [p. 204]. “Between the lines B and H, Fraunhofer observed 574 fainter lines and was able to give precise positions for some 350 of these in his drawing of the solar spectrum. In this figure he also indicated by the curve the approximate intensity distribution of the light in the spectrum as judged by the eye … Fraunhofer did not attempt to explain the origin of the dark solar lines. He knew they were intrinsic to the nature of sunlight, and not any instrumental effect. He restricted himself to careful and accurate observation rather than the speculation that characterized the work of some other spectroscopists over the next four decades. “Fraunhofer’s spectroscopic work did not stop at the Sun. Half a century ahead of his time, he initiated the science of planetary and stellar spectroscopy. With his theodolite telescope he observed the spectra of Venus, Sirius and other first-magnitude stars. For Venus, he wrote: ‘I have seen the lines D, E, b, F perfectly defined … I have convinced myself that the light from Venus is in this respect of the same nature as sunlight.’ For stars Fraunhofer found something surprisingly different: ‘I have seen with certainty in the spectrum of Sirius three broad bands which appear to have no connection with those of sunlight; one of these bands is in the green, two are in the blue. In the spectra of other fixed stars of the first magnitude one can recognize bands, yet these stars, with respect to these bands, seem to differ among themselves’ [p. 220] … “In 1819 the optical section (lens production) of the instrument firm was shifted to Munich. Fraunhofer therefore spent most of his time there, going only on occasions to Bedediktbeuern, where the glass works were kept. He died of tuberculosis when only 39, and it is likely he would have made further outstanding contributions to spectroscopy and telescope design had he survived a more normal lifespan. From 1826 the optical section of the firm was directed by Georg Mertz (1793-1867), who had been a pupil of Fraunhofer’s since 1808” (Hearnshaw, The Analysis of Starlight: Two Centuries of Astronomical Spectroscopy, pp. 17-20). The plate of the solar spectrum is regarded as one of the finest etchings produced hitherto. “Looking back at the beginning of that century, we appreciate even more the incredible skill with which the ‘amateur’ Fraunhofer had [produced] his famous map of the solar spectrum in 1814. Not even its later revisions, made between 1823 and 1831, could reproduce the intricate way in which Fraunhofer managed to convey the brilliance of the yellow-green region of the spectrum against its violet and red ends. Fraunhofer had carefully etched the map, timing the corrosion of each trace in proportion to the intensity of the respective spectrum line … for the black-and-white version of his map, to be published in the Memoirs of the Bavarian Academy of Sciences, he asked an unnamed printer to superimpose an Indian-ink wash on this etching to intensify the impression of darkness towards both ends of the visible spectrum; I have not seen this done in such sophistication on any other nineteenth-century spectrum plate. The resulting intensity gradient in Fraunhofer’s map is so even that more than one print expert consulted mistook it for an aquatint … a few hand-colored versions of Fraunhofer’s plate have been preserved. But unlike the published plate of 1814, these color versions lack the Indian-ink wash of the shaded areas into the red and violet extremes of the spectrum, displaying instead the full range of colors … These color plates indirectly also let us infer that the original illustration for the Munich memoirs was produced in a two-stage process: first a copper etching of all the line matter such as labels, caption, and the curve, as well as the spectrum lines inside the box. Microscopic inspection of the spectrum lines with their different widths and intensities confirms that they were etched rather than engraved to guarantee evenness of line width as well as consistent variation in line intensity. After this first printing stage was complete, the Indian-ink wash was added by hand. This involved two-stage process also explains the strange black frame enclosing Fraunhofer’s solar spectrum – a feature absent from other spectrum representations. The fairly thick frame gave the printer a few millimeters leeway in positioning a screen protecting the areas outside it, so that he could then apply the Indian ink liberally to guarantee a smoother gradient in the spectrum strip itself at the center. The ink-wash stage, which made the final result more expensive, was omitted for the few sheets destined to be hand-colored, as well as in the later reprinting for the Astronomische Nachrichten, where a French translation of Fraunhofer’s paper appeared in 1823” (Hentschel, Mapping the Spectrum: Techniques of Visual Representation in Research and Teaching, pp. 116-7). Hentschel found an invoice from the printer showing that that Fraunhofer ordered 421 copies of each plate. The autograph manuscript of this paper is held by the Deutsches Museum, Munich. Dibner 153 (offprint); Norman 836 (offprint); Parkinson, Breakthroughs, 260; PMM 278a (journal issue); Richard Green 125 (journal issue); Sparrow 70 (journal issue); The Dawn of Science and Technology 91 (journal issue).
4to (305x230 mm), pp. [viii], xlii, 62, 226, 91, [1], with 13 engraved plates, uncut. Original publisher’s boards with printed orange paper spine label (some browning and spotting to the boards, later paper label at foot of spine).
Item #5864
Price: $32,500.00
